
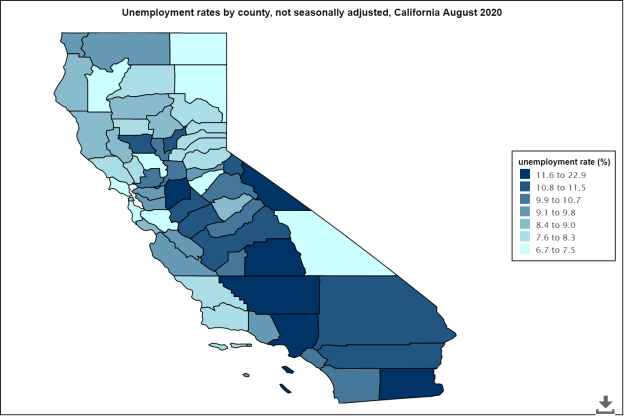
A while back I was playing around with a data mapping tool from the Bureau of Labor Statistics. I thought it would be an interesting idea for something ‘real’ to do with my students. I wrote a post with some examples of maps of California and Mississippi with the intent of showing how much our national unemployment rate at the time (3.7% or something) doesn’t always mean things are rosy everywhere. Here the new map, post Covid-19 for California – the scale has moved from a low of 1.7% in the San Francisco Bay Area and a high of 20.7% in Imperial County to a new range of 6.7% to 22.9%, with many more counties in that top bracket.

This is a significant shift. These data are from August, five months after the economy shut down across the State. The San Francisco Bay Area maintains some of the lowest unemployment rates, but the number of counties with 10% or higher unemployment rates has moved from 1 to 20 out of 58 counties.
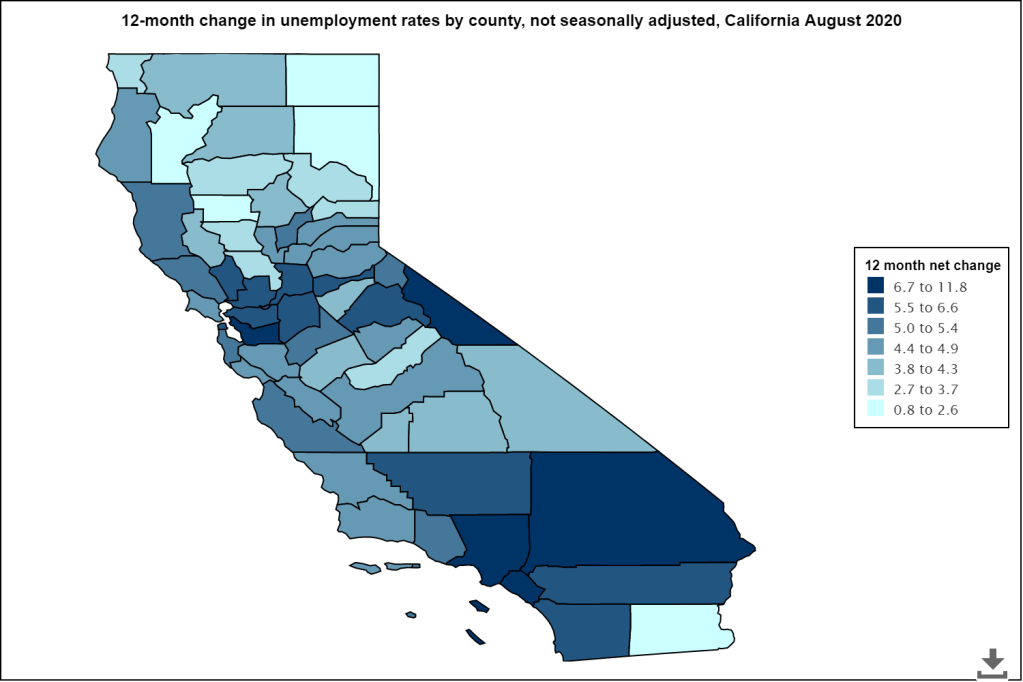
Here is a map of the net change from August 2019, one year prior. The darkest shades of blue represent the counties with the greatest percent increases in unemployment rates from August 2019 to August 2020. So, even those San Francisco Bay Area counties are seeing large percent changes in unemployment rates.
It will be interesting to see what the holiday season brings. Some expect to see less seasonal hiring this year. There’s a report about seasonal summer jobs from June 2020 for young adults from one of my favorite sources for great reporting on the economy, Marketplace. Here’s another great report on what we might see in our recovery period.
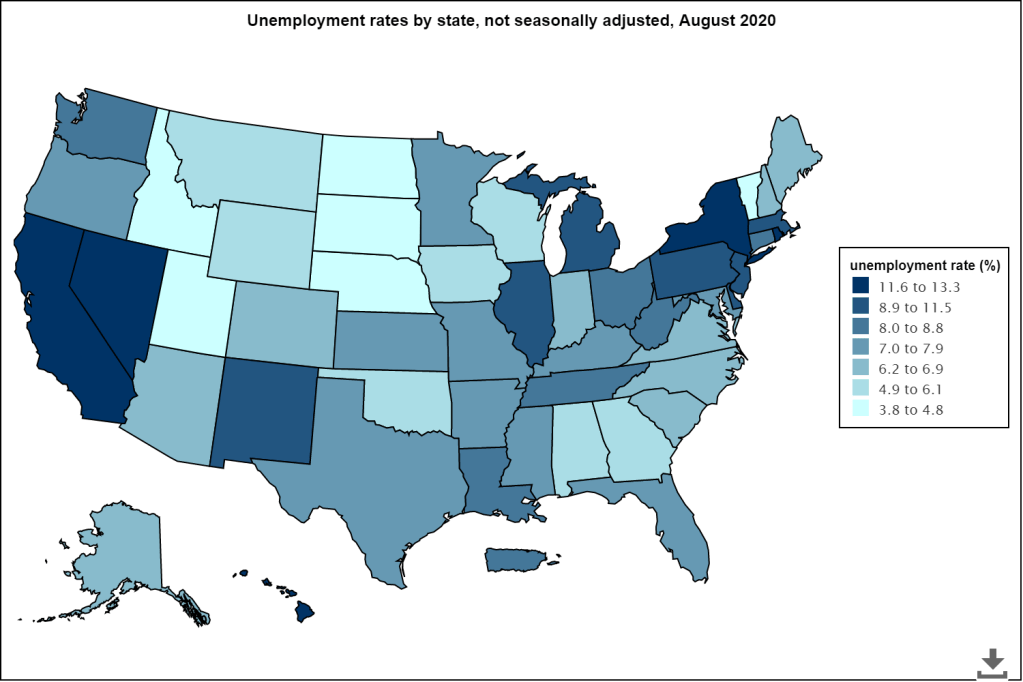
Overall rates are high in the US, particularly in California, Nevada, New York, and Hawaii.
Here’s map of the percent change from August 2019 to August 2020:
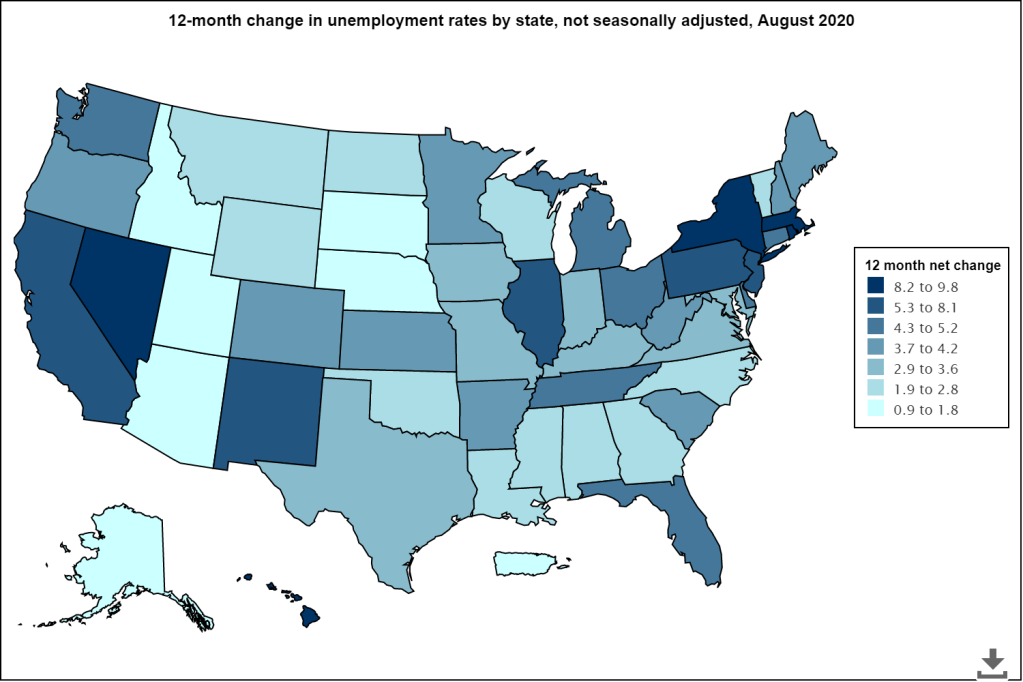
While some states are seeing change is the 1-2% range, others are in the 5-10% range. What makes these changes vary? The types of industries and employment in some areas are simply different. Some areas depend more on tourism, like Hawaii, where we see a 9.8% change in unemployment, one of the highest in the nation. ,Nevada Rhode Island, and Massachusetts are also among the highest with increases of 9.4%, 9.3% and 8.4% respectively.
California and New York are amongst the highest with increases of 7.4% and 8.5% landing them at unemployment rates of 11.6% and 12.6% respectively. That’s a big jump from last August when both of those highly populated states saw low unemployment rates of 4.2% (CA) and 4.1% (NY). That’s a lot of people out of work, and doesn’t account for the number of people who may have left the labor force or are currently underemployed.
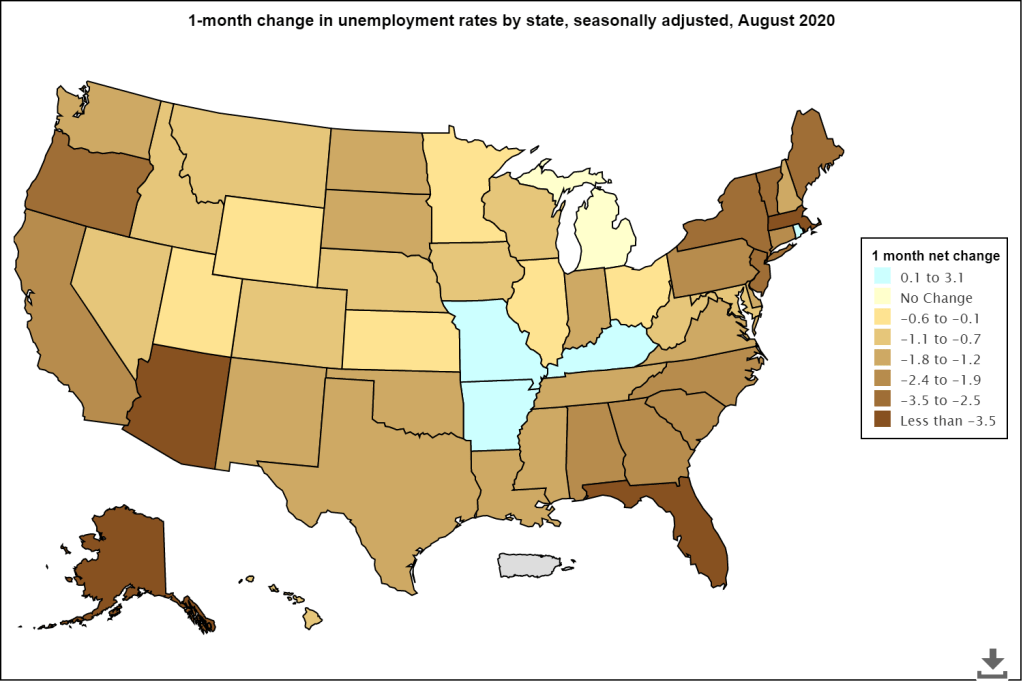
Nationally, things are better for most states compared to July 2020. The darker, the better. Those blue states are showing a slight increase, with Kentucky going from 4.5% unemployment to 7.6%, the biggest jump nationally.
Let’s keep our fingers crossed that job growth continues to go up and there is reliable vaccine that comes out soon. Here is a link to Marketplace reports on the vaccine dynamics: https://www.marketplace.org/collection/fast-track-vaccines/

