Category Archives: unemployment

Can’t get a job? Create your own. That seems to be plan for many in 2020.

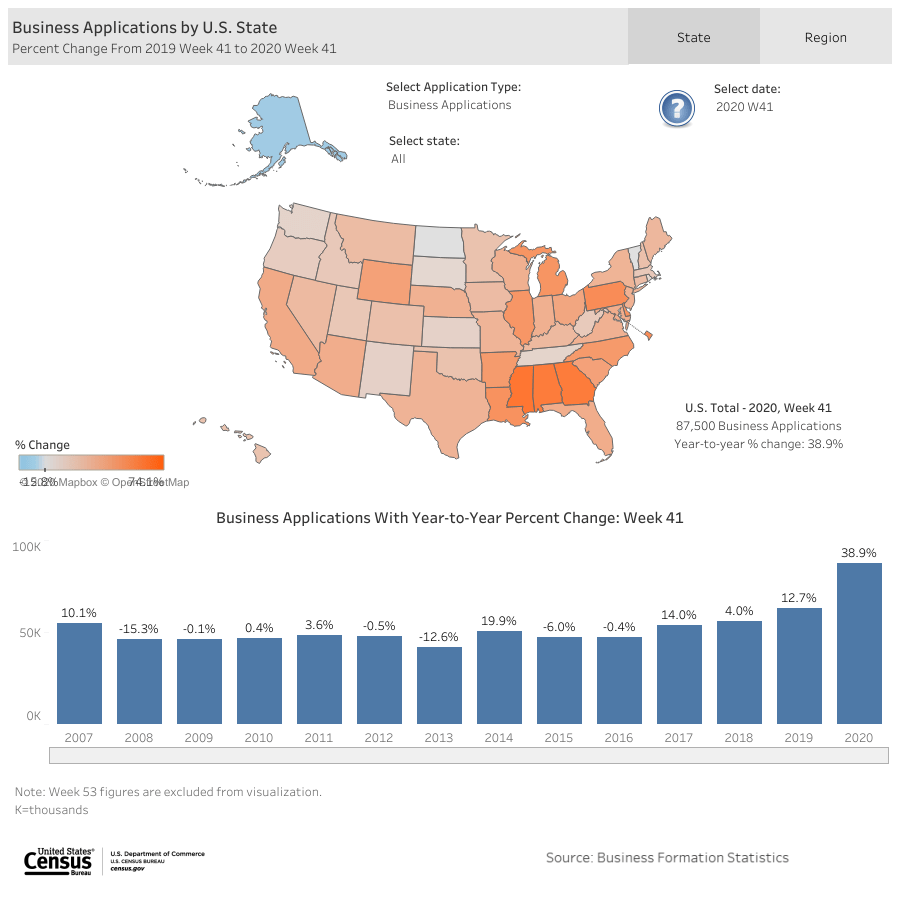
According to recent data from the US Census, business applications are up almost 40% from last year, with most of that happening in the third quarter of 2020. The charts below show percent changes for week 41 (out of 52) for 2020 and 2019. For week 41, there are 38.9% more applications this year than in 2019. For comparison, the applications in 2019 were 12.7% higher than 2018, which was only 4.0% higher than 2017.

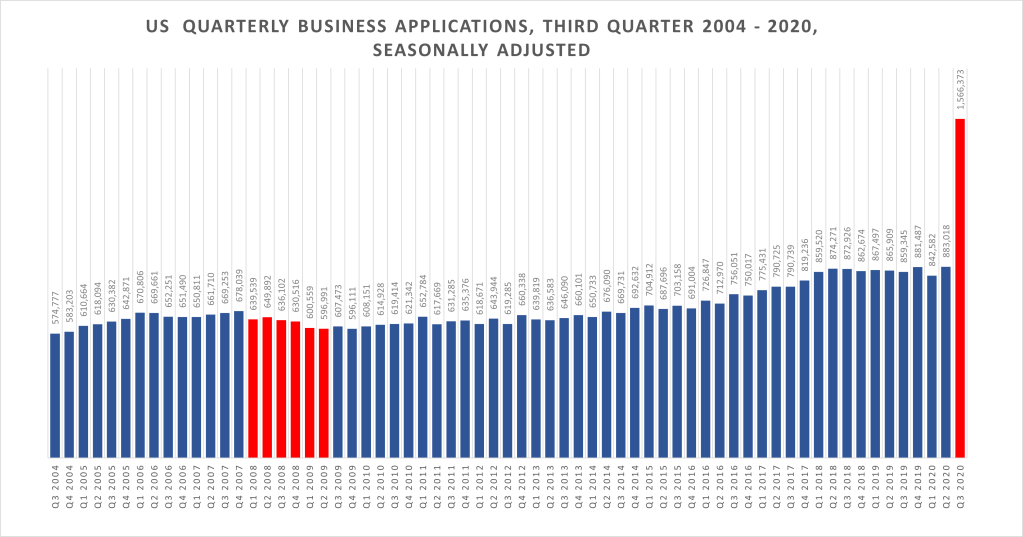
The chart below shows a skyrocketing increase in applications in the third quarter of 2020. We didn’t see these kinds of increases during the great recession (in red). So, why do we see this now? What is different this time around? I’m wondering if people are re-starting old businesses. Even so, I would have expected to see a dip in the second quarter, but there isn’t one.

Source: QuantGal created chart using data downloaded from US Census, Business Formation Statistics, 2020 Q3

Last time, there were financial factors creating the crash. This time, it’s much more intense, with entire sectors of the economy shutting down for months. World travel came to a near stand still. This is global and is greatly impacting supply chains for manufacturing and retails sectors. This is a horse of a different color. We are still having to wait and see what happens as we head into cold and flu season. Our physical health is at risk. Our financial and economic health is at risk. We are also heading into the retail sectors favorite time of year. But this year will be different – less travel, less shopping, less events and parties.

We still don’t know if we will see another wave of shut downs and hospital crises. We are still playing wait and see.

[ Note: You can learn how to create your own bar charts using FRED data with this pdf.]

Overall unemployment rates look bleak, while varying greatly by California county and nationally

A while back I was playing around with a data mapping tool from the Bureau of Labor Statistics. I thought it would be an interesting idea for something ‘real’ to do with my students. I wrote a post with some examples of maps of California and Mississippi with the intent of showing how much our national unemployment rate at the time (3.7% or something) doesn’t always mean things are rosy everywhere. Here the new map, post Covid-19 for California – the scale has moved from a low of 1.7% in the San Francisco Bay Area and a high of 20.7% in Imperial County to a new range of 6.7% to 22.9%, with many more counties in that top bracket.

Source: QuantGal inquiry using US Census data Mapping Tool

This is a significant shift. These data are from August, five months after the economy shut down across the State. The San Francisco Bay Area maintains some of the lowest unemployment rates, but the number of counties with 10% or higher unemployment rates has moved from 1 to 20 out of 58 counties.

Here is a map of the net change from August 2019, one year prior. The darkest shades of blue represent the counties with the greatest percent increases in unemployment rates from August 2019 to August 2020. So, even those San Francisco Bay Area counties are seeing large percent changes in unemployment rates.

It will be interesting to see what the holiday season brings. Some expect to see less seasonal hiring this year. There’s a report about seasonal summer jobs from June 2020 for young adults from one of my favorite sources for great reporting on the economy, Marketplace. Here’s another great report on what we might see in our recovery period.

Overall rates are high in the US, particularly in California, Nevada, New York, and Hawaii.

Here’s map of the percent change from August 2019 to August 2020:

While some states are seeing change is the 1-2% range, others are in the 5-10% range. What makes these changes vary? The types of industries and employment in some areas are simply different. Some areas depend more on tourism, like Hawaii, where we see a 9.8% change in unemployment, one of the highest in the nation. ,Nevada Rhode Island, and Massachusetts are also among the highest with increases of 9.4%, 9.3% and 8.4% respectively.

California and New York are amongst the highest with increases of 7.4% and 8.5% landing them at unemployment rates of 11.6% and 12.6% respectively. That’s a big jump from last August when both of those highly populated states saw low unemployment rates of 4.2% (CA) and 4.1% (NY). That’s a lot of people out of work, and doesn’t account for the number of people who may have left the labor force or are currently underemployed.

Nationally, things are better for most states compared to July 2020. The darker, the better. Those blue states are showing a slight increase, with Kentucky going from 4.5% unemployment to 7.6%, the biggest jump nationally.

Let’s keep our fingers crossed that job growth continues to go up and there is reliable vaccine that comes out soon. Here is a link to Marketplace reports on the vaccine dynamics: https://www.marketplace.org/collection/fast-track-vaccines/