In 2013, I wrote my master’s thesis on Algebra 2 as a gatekeeper course. I used performance data from the standardized test at the time, the STAR test. It tested every student every year in mathematics, by the course they took.
Since then, some things have changed including the standards we teach for each course and the frequency at which we test students. We administer a standardized test in high school mathematics only in the 11th grade. There are some others, but this is the main one for monitoring proficiency levels on a wide-scale basis throughout California.
I was wondering if our proficiency scores had improved over time. At a glance, they haven’t. But, let’s dig deeper. In some ways, this is an apple to oranges comparison because now all students take the same exam in their junior year of high school, instead of taking an exam every year, based on which course they are currently taking. The exam is administered mostly online and is apparently interactive. You can get detailed information about how the exam works here. In fact, there is a lot of detail there and it may be overwhelming, so good luck!
I decided that the best approach for comparison would simply be to look at the Algebra 2 proficiency scores and compare them to the 11th grade exam, since it is the recommended path that most students take Algebra 2 by their junior year, even though some take it sooner and some take it later.
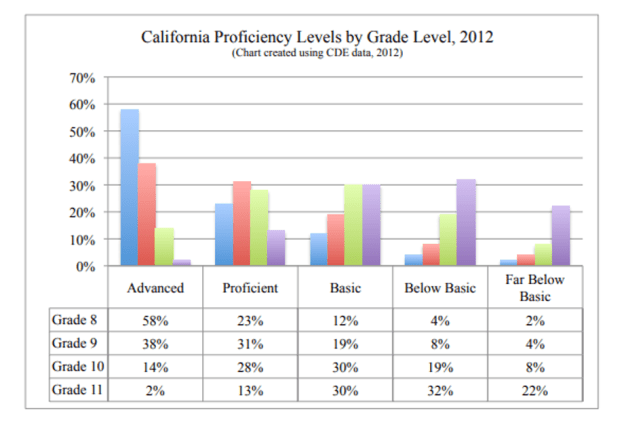
You can see the results for 2012 Algebra 2 proficiency for each of the Counties in the 9-County San Francisco Bay Area and the State of California here. The main graphic that shows the break down of proficiency level by grade for Algebra 2 is below:
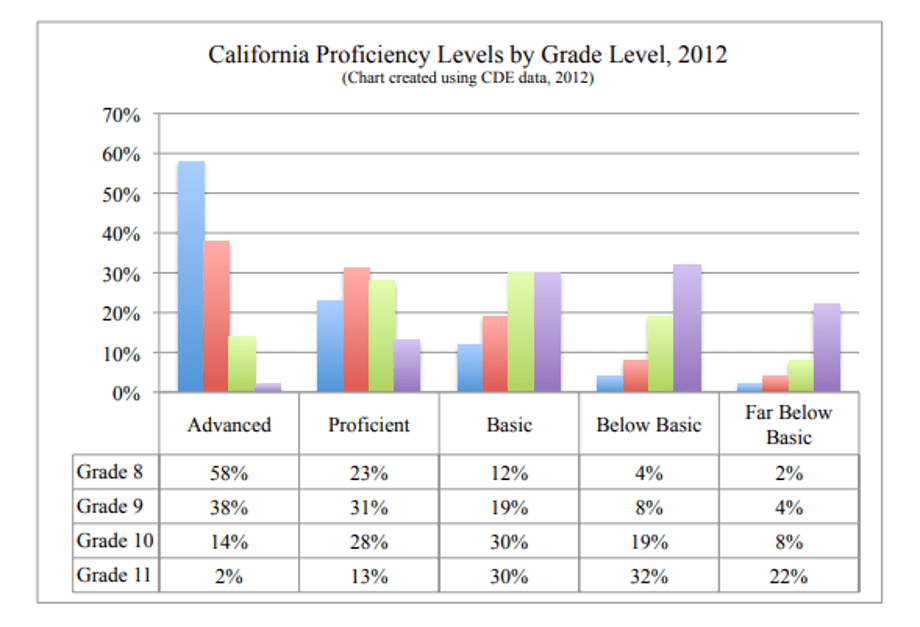
This chart shows proficiency levels by grade for Algebra 2. You can see that the younger students are doing better than the older students. The reasons for this are explored in the thesis. This post is meant to focus on whether or not things have improved since then. The thesis examines breakdowns of proficiency levels by grade (above) and by gender and race and ethnicity levels. For comparison purposes, let’s look at the California dashboard for math proficiency scores for 2017-2018. I would think, with seven years of transition time, an easing of the standards, more emphasis placed on understanding relationships and an interactive test, we will see a strengthening in our proficiency levels. Below are the overall results for proficiency levels for the state for 2018-2019.
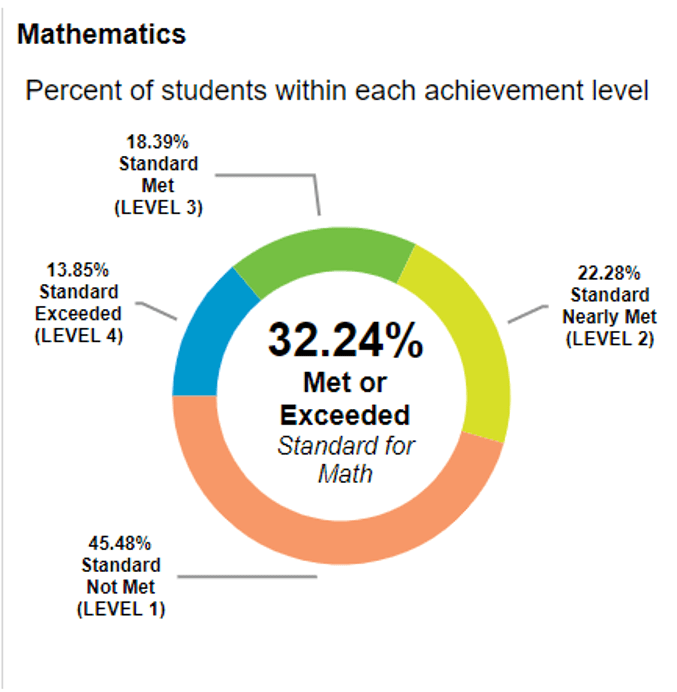
Source: California Department of Education Website, 01/20/20.
I don’t know about you, but the 32.24% met or exceeded Standard for Math does not seem very good to me. Back in 2012, many students were taking Algebra 1 in 8th grade – the popular thought at the time was that younger students were doing better, so have all students take algebra in 8th grade. That has since gone by the wayside as many students were not successful in that model. For tenth graders, though, proficiency levels for the state were at 42% (link to report and view pages 22-23 for detailed state and county information).
Unfortunately, with all the implemented changes, there doesn’t seem to be an improvement in outcomes. The reasons are plentiful, but it’s got me questioning our system. We are teaching an antiquated model: Algebra 1, Geometry, Algebra 2 in an attempt to move students to Calculus and be successful. However, I question this goal. In practice, many people working in analytic fields requiring mathematics backgrounds are using computers to solve problems and make calculations. Those computer skills – programming, analysis, and data use, are not making it into the classroom until much later in a student’s education career.
There is a move to make more changes to our system that incorporate some data science which includes analyzing data, learning to write some code, and understanding how to create data displays. I have no idea if this approach would raise proficiency scores, but I don’t really care. I think the testing system is dramatically flawed and we keep trying to get the teaching and testing right around these antiquated approaches to the curriculum pathway.
I believe the core three years of mathematics education should shift from proof and abstract problems to applied problems that prepare students for careers other than mathematicians. Our system builds from generations of candlelight and paper and pencil-based tools. That simply is no longer our reality and we need to make some jumps in our methods and expected outcomes.
We should keep teaching about functions and lines and logarithms and conic sections. It’s just that we should include applications. Applications are abundant. We need people who work in fields that use these functions, programs and relationships to help design effective and interesting problems for students. I know that I can do this in economics, and there are others who can do this with physics, medicine, engineering, etc.
We can teach students some coding using R, but teachers need to learn it, too. There are free resources to help with that! Just google “free resources for learning R.” Wait, I just did and have included a link at the bottom of this post.
The opinions stated above are mine alone – oh wait! They are not mine alone. Please check out Jo Boaler’s YouCubed website if you don’t believe me: https://www.youcubed.org/resource/data-literacy/ Then, Scroll to the bottom and see all of the articles and resources that back up this idea.
My other big concern is how today’s math teachers, who may not have had experience with data analysis, are going to be able to implement changes. I am hoping to help with this.
You can read more about my experience with math and data analysis here: https://quantgal.com/2019/12/17/algebra-2-college-prep-career-prep-or-both/
You can learn more about my professional background via my linked In page here: https://www.linkedin.com/in/lauriehailer/
R-Bloggers site (free resource for learning R): https://www.r-bloggers.com/learning-r-for-free-free-online-resources/